Nuclear-Powered Ocean Liming System
Executive Summary
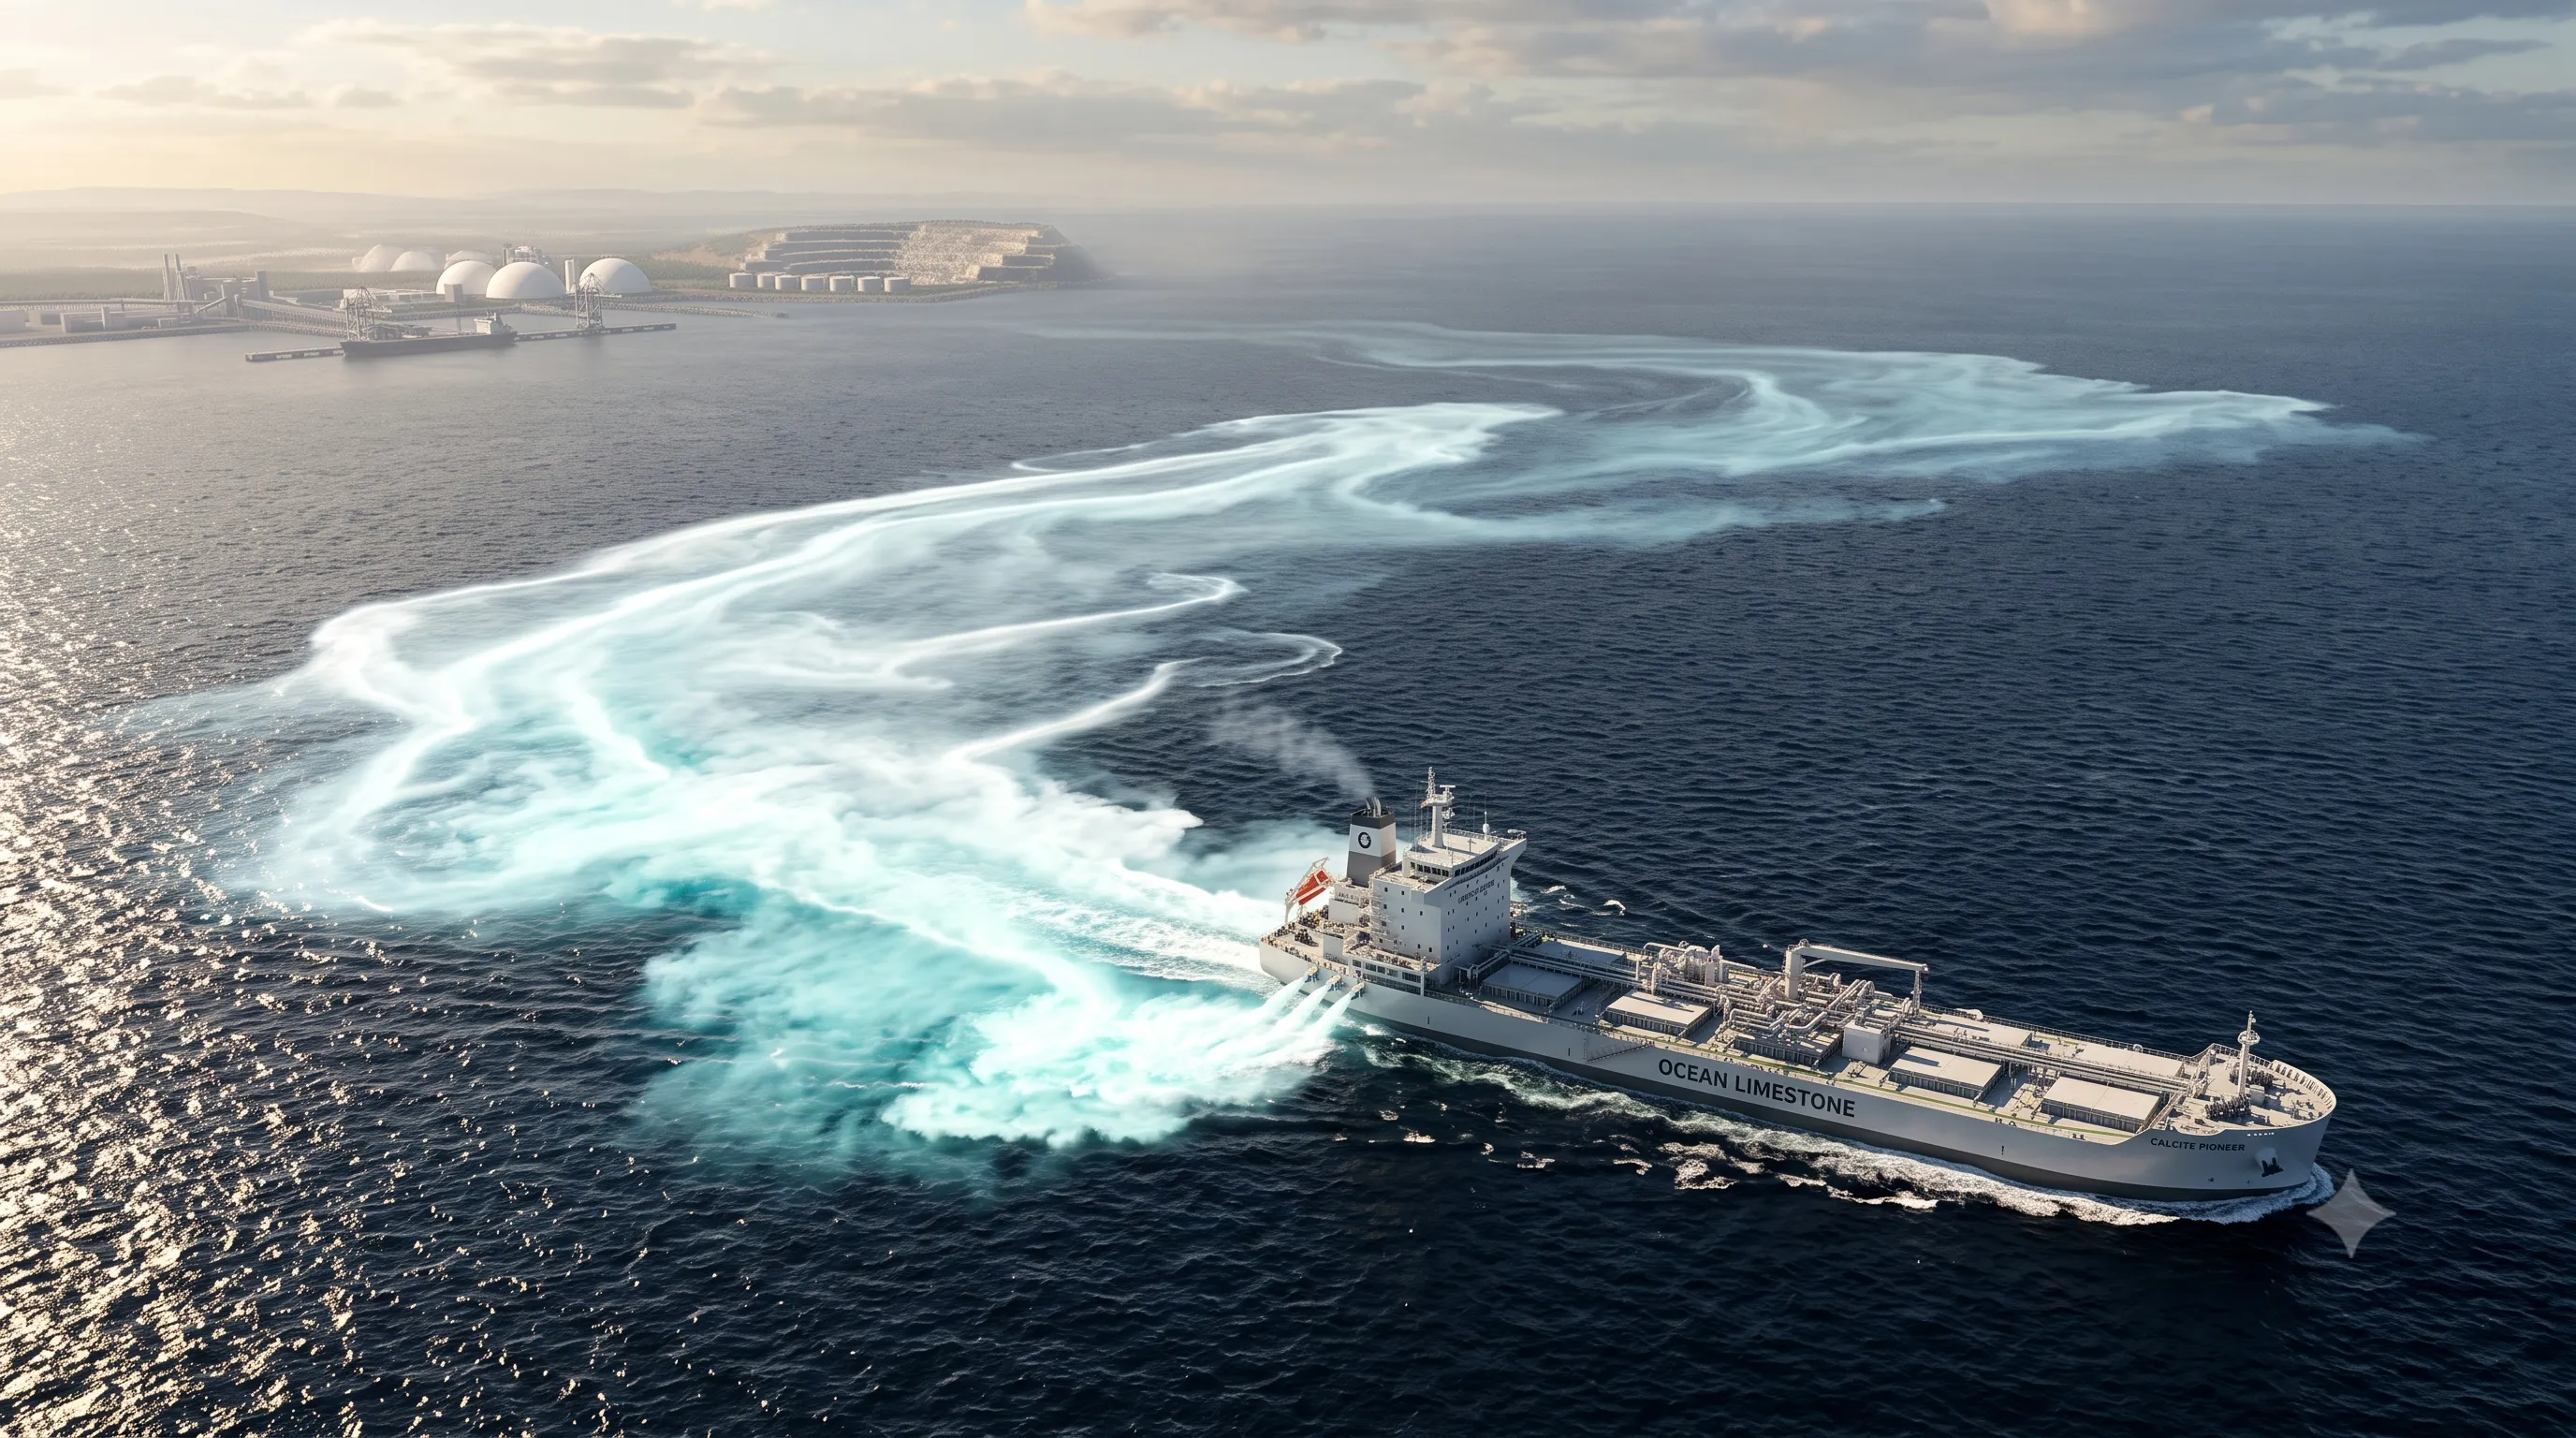
This whitepaper describes a repeatable industrial system for ocean liming at very large scale. The proposed system mines limestone, converts it in standardized calcination plants powered by on-site small modular nuclear reactors, captures and stores the calcination CO₂, delivers dry quicklime to ports, and disperses slaked lime at sea using purpose-built ships.
The core system is:
limestone quarry → nuclear-powered direct-separation calcination plant → captured calcination CO₂ to geological storage (or accelerated-weathering disposal) → dry quicklime to port terminal → purpose-built dispersal ship with onboard slaking → monitored open-ocean alkalinity release
Five architecture choices drive the economics, and this design commits to them explicitly:
- Heat-integrated, cogeneration-based calcination. Product sensible heat is recuperated and nuclear steam/heat carries drying and preheat, cutting net energy demand 25–35% versus a naive all-electric design. A steam-mediated direct-heat calcination variant, if proven, roughly halves the nuclear requirement again.
- Dry CaO as the shipped cargo, slaked onboard with seawater. This delivers ~32% more alkalinity per deadweight tonne than carrying hydrated lime; the slaking water is free at the discharge site.
- High-rate dispersal engineering. The dispersal fleet size is set by discharge time, not cargo capacity. Engineering the release system for ~100 kg/s (versus the 50 kg/s literature baseline) roughly halves the fleet.
- Tiered siting that deletes rail where geography allows. Tier-1 sites co-locate quarry, plant, port, and CO₂ storage on one coastal footprint, eliminating the rail system entirely.
- Credited ocean uptake treated as a first-order cost lever. Dispersal optimization that raises credited uptake from ~1.1 toward ~1.4 tCO₂/tCaO is worth as much as a 10–15% cost reduction across the entire physical system.
For a 10 GtCO₂/yr gross ocean-liming target, the system would require approximately:
| System element | Order-of-magnitude scale |
|---|---|
| Limestone mined | 13–16 Gt/yr |
| Quicklime produced | 7.1–9.1 Gt CaO/yr |
| Calcination CO₂ captured and stored | 5.6–7.2 GtCO₂/yr |
| Standard calcination plants | ~2,900–3,600 plants |
| Nuclear capacity | ~0.9–1.4 TWe (~0.5–0.8 TWe-eq with direct heat) |
| Purpose-built 75,000 dwt dispersal ships | ~3,800–5,000 ships |
| Specialized ports | hundreds of terminals |
| Total overnight capital | ~$28–70 trillion |
| Annualized all-in system cost | ~$2.5–6 trillion/yr |
| Likely early/mature net removal cost | ~$250–700/tCO₂ net removed |
| Long-term stretch cost | ~$150–300/tCO₂ |
The concept is technically plausible in pieces, but at full scale it is not a normal carbon-removal project. It is a planetary-scale industrial infrastructure program spanning limestone mining, nuclear deployment, high-temperature calcination, CO₂ storage, bulk logistics, shipbuilding, marine monitoring, and international ocean governance.
The system only makes climate sense if the calcination CO₂ is captured and permanently disposed of. Pure limestone releases about 0.44 tCO₂ per tonne limestone during calcination,1 and high-calcium quicklime production releases about 0.79 tCO₂ per tonne CaO as process CO₂ before capture.2
1. Carbon Removal Mechanism
Ocean liming is a form of ocean alkalinity enhancement. Limestone, mostly calcium carbonate, is calcined to make quicklime:
CaCO₃ → CaO + CO₂The quicklime is then hydrated — in this design, onboard the dispersal ship using seawater:
CaO + H₂O → Ca(OH)₂When slaked lime dissolves into seawater, it increases alkalinity and converts dissolved CO₂ into bicarbonate:
Ca(OH)₂ + 2CO₂ → Ca²⁺ + 2HCO₃⁻In principle, 1 tonne of CaO can support up to ~1.57 tonnes of CO₂ uptake after hydration and reaction to bicarbonate. In practice, ocean mixing, local saturation state, carbonate precipitation, imperfect dissolution, air-sea equilibration timescales, and MRV conservatism reduce credited uptake.
1.1 Credited uptake as a design variable, not a constant
This whitepaper treats the credited-uptake ratio as an engineering target rather than a fixed haircut:
- Conservative floor: ~1.05–1.1 tCO₂ credited per tonne CaO delivered
- Design target with optimized dispersal: ~1.2–1.4 tCO₂/tCaO
- Theoretical ceiling: ~1.57 tCO₂/tCaO
Every point of credited uptake flows directly into $/tCO₂: raising the ratio from 1.1 to 1.4 reduces the cost per tonne by ~21% with zero additional hardware. The levers are particle-size control (fine Ca(OH)₂ dissolves before sinking), discharge into cold, well-mixed, CO₂-undersaturated surface waters, keeping the local aragonite saturation state below runaway-precipitation thresholds, multipoint dilution to avoid pH spikes, and route/season selection that keeps the alkalinity in contact with the atmosphere long enough to complete air-sea equilibration. Dispersal optimization is therefore funded explicitly in Phases 0–1 as a cost-reduction program, not only as a safety program.
The system-level mass balance used throughout:
- 13–16 tonnes limestone per 10 tonnes gross CO₂ target
- 7.1–9.1 tonnes CaO per 10 tonnes gross CO₂ target
NOAA describes ocean alkalinity enhancement as adding alkaline material to the surface ocean to increase carbon uptake and storage, while noting that ocean circulation, environmental impacts, carbon removal effectiveness, and monitoring feasibility remain critical constraints.3
2. Key Design Assumptions
| Assumption | Planning value |
|---|---|
| Limestone-to-quicklime mass yield | ~56% CaO by mass |
| Calcination CO₂ from limestone | ~44% of limestone mass |
| Feedstock specification | High-calcium limestone, low dolomite (see §3.3.A) |
| Cargo shipped by sea | Dry CaO, slaked onboard |
| Hydration/slaking location | Onboard dispersal ship (port as fallback) |
| Standard plant limestone input | ~4.5 Mt/yr |
| Standard plant quicklime output | ~2.5 Mt CaO/yr |
| Standard plant calcination CO₂ stream | ~2.0 MtCO₂/yr |
| Standard plant theoretical ocean uptake | ~4.0 MtCO₂/yr |
| Standard plant credited/design uptake | ~2.8–3.5 MtCO₂/yr gross, subject to MRV |
| Plant power demand (heat-integrated) | ~300–380 MWe continuous |
| Nuclear package | 4–5 × 80 MWe HTGR modules in cogeneration, or equivalent |
| Advanced calcination variant | Steam-mediated direct nuclear heat at ~700–780°C (§3.3.B) |
| Purpose-built ship size | ~75,000 dwt |
| Ship cargo | ~63,750 t dry CaO/voyage |
| Design discharge rate | ~100 kg/s Ca(OH)₂ (50 kg/s validated baseline) |
| Ship annual delivery | ~1.8–1.9 Mt CaO/yr |
| Ships per standard plant | ~1.3 ships/plant |
3. Standard Calcination Plant Module
3.1 Module Purpose
The standard plant converts limestone into quicklime while capturing the calcination CO₂. The plant is designed as a copy-exactly industrial module that can be deployed repeatedly near limestone resources and CO₂ disposal, preferentially on coastal sites (§4).
3.2 Plant Scale
| Plant metric | Reference module |
|---|---|
| Limestone input | ~4.5 Mt/yr |
| Quicklime output | ~2.5 Mt CaO/yr |
| Calcination CO₂ generated | ~2.0 MtCO₂/yr |
| Calcination CO₂ captured/stored | ~1.9–2.0 MtCO₂/yr |
| Theoretical ocean uptake from CaO | ~4.0 MtCO₂/yr |
| Credited/design gross uptake | ~2.8–3.5 MtCO₂/yr |
| Continuous power demand | ~300–380 MWe |
| Calciner trains | 6–10 parallel trains |
| Limestone input (rail or in-plant conveyor) | ~12,000–14,000 t/day |
| Quicklime output | ~7,000–8,000 t/day |
| CO₂ compression/storage flow | ~5,500–6,100 tCO₂/day |
3.3 Plant Architecture
The plant has eight major blocks.
A. Receiving and Limestone Preparation
- Unit-train receiving loop (Tier-2 sites) or direct quarry conveyor (Tier-1 sites, §4)
- Crushers and screens
- Limestone blending and stockpiles
- Covered conveyors
- Drying or moisture-control system where required
- Dust control and water management
Feedstock specification matters at this scale. The plant requires high-calcium limestone with low dolomite content: MgO slakes poorly, and Mg(OH)₂ dissolves slowly and dilutes alkalinity delivered per tonne shipped. Silica and clay burden increase refractory wear and dust load. At 13–16 Gt/yr the system draws roughly three times the limestone throughput of today’s global cement sector; the binding constraint is quarry permitting and quality, not geological abundance, so feedstock chemistry should be a formal siting criterion alongside logistics.
At Tier-2 (inland) sites, the rail system should be treated as mission-critical infrastructure, not a support utility. The plant moves material at the scale of a large coal, ore, or cement terminal.
B. Direct-Separation Calcination Island with Full Heat Integration
The preferred calcination route is indirectly heated / direct-separation calcination, not a conventional flame-fired kiln. The objective is to keep the process CO₂ released by limestone separate from combustion gas and atmospheric nitrogen.
LEILAC describes this approach as indirectly heated calcination that separates unavoidable process CO₂ emissions for storage or use. The approach is being developed for cement and lime, and is described as energy-agnostic and electrification-ready.4
Heat integration is mandatory, not optional. Both product streams — CaO and CO₂ — leave the calciner at ~900°C, carrying roughly 1.3 GJ of sensible heat per tonne of CaO against a naive energy demand of ~4.5 GJ/t. Countercurrent recuperation (hot CO₂ and hot CaO preheating incoming limestone) plus cogenerated nuclear steam for drying reduces net external energy demand to roughly 3.3–3.8 GJ/t CaO, a 25–35% cut. This is why the reference plant needs ~300–380 MWe rather than the 400–500 MWe an unintegrated all-electric design would demand — and at system scale the difference is several hundred GW of nuclear capacity.
Baseline heat delivery: the calcination reaction itself must proceed at ~900–950°C in a pure-CO₂ atmosphere — above HTGR coolant outlet temperature — so the reaction enthalpy (~3.2 GJ/t CaO) is delivered electrically in the baseline design, with nuclear steam and recuperated heat carrying drying and preheat.
Advanced variant — steam-mediated direct nuclear heat. Diluting the calciner atmosphere with superheated steam lowers the CO₂ partial pressure, which lowers the required calcination temperature into the ~700–780°C range — within reach of HTGR primary heat. The steam is then condensed out of the off-gas, preserving a pure CO₂ stream for storage, and steam calcination also improves CaO reactivity. If proven, this variant delivers the reaction enthalpy at ~100% thermal efficiency instead of through a ~40%-efficient electric conversion, roughly halving the reactor capacity per plant (to ~2–3 HTGR modules operated mostly in heat mode). This is the single largest identified cost-reduction opportunity in the system and is gated as a dedicated R&D line in Phases 1–3.
A standardized module should use 6–10 parallel calciner trains. This reduces single-train failure risk, supports planned maintenance, and enables factory-style replication.
C. Nuclear Heat-and-Power Island
The heat-integrated plant requires roughly 300–380 MWe of continuous power plus cogenerated steam. A high-temperature gas reactor package is a natural fit because it supplies both electricity and high-grade steam/heat. The NRC describes X-energy’s Xe-100 as a pebble-bed, high-temperature gas-cooled reactor producing 200 MWth and approximately 80 MWe per reactor, with a four-pack plant producing approximately 320 MWe.5
A reference plant might use:
- 4–5 × 80 MWe HTGR modules in cogeneration mode (electricity for calcination and CO₂ compression; extraction steam for drying and preheat), or
- 2–3 modules operated heat-forward if the steam-mediated calcination variant is proven, or
- a larger SMR plus electric boosting
Cluster-scale alternative — the nuclear park. Licensing a reactor package at every one of ~3,000 plant sites is arguably the program’s binding schedule constraint. Where plants cluster regionally (§4, Phase 3), a single large licensed nuclear park of several GW serving 5–10 calcination plants over short private transmission and steam ties cuts licensing actions roughly tenfold, concentrates security and emergency-planning overhead, and improves nuclear economics. The standard plant design must therefore accept either an on-site reactor island or a park connection without redesign.
The nuclear island should be operationally isolated from the calcination process even if electrically coupled through a private microgrid. The industrial side must be able to trip without causing unsafe nuclear operating transients.
D. CO₂ Conditioning and Disposal Interface
Because the calciner avoids dilution by combustion gas, the off-gas is mainly CO₂ plus dust and water vapor (and steam, in the advanced variant). The CO₂ train includes:
- hot cyclones or ceramic filters
- dust polishing
- heat recovery
- condensation and drying
- compression to dense-phase or storage pressure
- metering
- pipeline or injection interface
- emergency vent and monitoring system
Every standard plant generates roughly 2 MtCO₂/yr that must be permanently disposed of. Two disposal pathways are supported:
- Geological storage (baseline): saline formations, depleted reservoirs, or shared CO₂ pipeline networks. Site selection should prioritize nearby storage.6
- Accelerated weathering of limestone (AWL) at storage-poor coastal sites (§5): the captured CO₂ is reacted with crushed raw limestone in seawater contactors, converting it directly to ocean bicarbonate and eliminating the pipeline/injection chain at that site.
E. Quicklime Cooling, Storage, and Loadout
Quicklime exits the calciner hot and reactive. After recuperative cooling (§3.3.B), it must be screened, dedusted, kept dry, and loaded into sealed railcars or port conveyors.
Key design requirements:
- dry silos or domes
- pneumatic conveyors
- covered-hopper loadout
- moisture exclusion
- dust explosion and worker-safety controls
- caustic spill response
- fire and heat monitoring
The system exports dry CaO end-to-end — plant to railcar to ship hold — because CaO is the most mass-efficient form of the alkalinity. Hydration adds ~32% dead water mass; that water is available for free from seawater at the discharge site.
F. Plant Utilities
- industrial water treatment
- cooling systems
- high-voltage distribution
- heat-recovery systems
- refractory maintenance shops
- compressed air and nitrogen
- fire protection
- laboratory and QA/QC
- environmental monitoring
G. Control and Monitoring
The plant requires integrated control of:
- limestone feed chemistry
- calciner temperature profile
- CaO reactivity
- CO₂ purity
- CO₂ capture and disposal metering
- logistics interfaces
- quicklime moisture
- product traceability
H. Buffer Storage
A resilient plant should carry:
- 15–30 days of limestone inventory
- 7–14 days of quicklime inventory — deliberately short, because stored CaO degrades: it air-slakes with atmospheric moisture and recarbonates with atmospheric CO₂, losing reactivity and alkalinity value
- enough CO₂ buffer and compression redundancy to avoid venting during short disruptions
4. Siting Strategy: Three Tiers
The original chain — inland plant, limestone rail in, quicklime rail out — is the general case, but rail is one of the largest capital and operating lines in the system. Limestone deposits, deepwater ports, and saline storage formations co-occur in many regions (the Gulf of Mexico coast, the Adriatic, Southeast Asia, northwest Australia, among others). Siting is therefore organized in tiers, and deployment fills the best tiers first.
| Tier | Configuration | Rail requirement | Priority |
|---|---|---|---|
| Tier 1 | Coastal quarry + plant + port + CO₂ storage (or AWL) on one footprint | None — quarry-to-plant conveyors, plant-to-ship loaders | Fill first; target for Phases 2–3 |
| Tier 2 | Inland quarry + plant near storage; dry quicklime by rail to port | One rail leg (quicklime out) | General case |
| Tier 3 | Inland plant remote from storage; CO₂ by long pipeline | Rail + long CO₂ pipeline | Marginal; avoid |
A Tier-1 site eliminates both rail legs, one transloading step, and most of the materials-handling footprint. Even if only a third of global capacity qualifies for Tier 1, the saving is on the order of $1–3T in capital plus the largest single OPEX line at those plants. Note that calcining at the quarry (rather than shipping limestone) is already load-bearing in all tiers: calcination sheds 44% of the rock mass, so quicklime always travels further than limestone.
Regional clusters (Phase 3) should be planned as integrated Tier-1/Tier-2 basins sharing a nuclear park (§3.3.C), a CO₂ storage hub, and a port complex.
5. The AWL Variant for Storage-Poor Sites
The baseline requires geological storage at every plant. Sites without accessible storage would otherwise be disqualified — a hard constraint the risk register flags as a first-order bottleneck. There is a chemistry escape hatch at coastal sites: accelerated weathering of limestone (AWL).7
CaCO₃ + CO₂ + H₂O → Ca²⁺ + 2HCO₃⁻Instead of compressing and injecting the captured calcination CO₂, it is reacted with crushed raw limestone in seawater contactors at the plant/port. This simultaneously:
- disposes of the process CO₂ as stable ocean bicarbonate (no pipelines, no injection wells, no long-term reservoir liability), and
- adds additional ocean alkalinity, contributing credited uptake of its own.
The costs are additional limestone throughput (raw, uncalcined — cheap) and large seawater pumping and effluent-dilution systems. AWL is not universally better than geological storage — it requires coastal siting, high water throughput, and careful effluent monitoring — but as a site-dependent variant it removes the hardest siting constraint in the system and diversifies the program away from a single CO₂-storage bottleneck. Phase 1 includes an AWL pilot alongside the geological-storage chain.
6. Port Terminal Module
Each port terminal transfers dry quicklime from land transport to ships and supports safe ocean dispersal.
| Port asset | Function |
|---|---|
| Covered rail/conveyor unloading | Receive dry CaO safely |
| Dry storage silos/domes | Prevent moisture exposure |
| Pneumatic conveyors | Dust-controlled material handling |
| Dry-cargo ship loading | Load dry CaO into sealed holds |
| Fallback slaking equipment | Convert CaO to Ca(OH)₂ slurry if a vessel cannot slake onboard |
| Seawater intake and dilution | Support fallback slurry preparation |
| Environmental lab | Verify reactivity, contaminants, particle size |
| Monitoring center | Coordinate ship routes and discharge limits |
| Emergency systems | Manage caustic dust, slurry, and heat release |
Preferred handling pathway:
dry CaO by rail or conveyor → enclosed port storage → sealed dry loading → onboard seawater slaking at sea → metered open-ocean release
Slaking at the port is retained only as a fallback: every tonne of water added before the ship sails displaces a tonne of alkalinity-bearing cargo. The port should never dump dry quicklime directly into seawater. Dry CaO is caustic, reacts exothermically with water, and can create unsafe local pH spikes if not diluted and controlled.
7. Purpose-Built Ocean Dispersal Ship
7.1 Baseline Ship
This whitepaper builds on the dedicated-ship concept from Caserini et al., who analyzed purpose-built 75,000 dwt ships releasing slaked lime at up to 50 kg/s over about 21 trips/year.8 This design departs from that baseline in two deliberate ways:
Dry CaO cargo, slaked onboard. Carrying 63,750 t of CaO instead of the equivalent hydrated lime delivers 1.32× the alkalinity per deadweight tonne (molar mass 56 vs 74) — the slaking water is taken from the sea at the point of use. The exothermic slaking heat (~1.16 GJ/t CaO) is absorbed by the same seawater flow used for dilution.
Doubled design discharge rate. At 50 kg/s, a full cargo takes roughly two weeks to discharge — ~85% of each voyage cycle is discharge time, meaning the fleet size is set almost entirely by release rate, not by cargo capacity or transit speed. The design target is therefore ~100 kg/s Ca(OH)₂ achieved through dispersal engineering: multipoint injection manifolds across the beam, towed diffuser arrays, and higher-energy wake mixing. Caserini et al. themselves note that higher rates require dedicated engineering and multiple discharge points8; this design treats that engineering as a primary program objective, because it roughly halves the fleet.
| Ship metric | Reference value |
|---|---|
| Vessel class | Purpose-built dry-bulk dispersal vessel with onboard slaking |
| Deadweight | ~75,000 dwt |
| Active cargo fraction | ~85% |
| Cargo | ~63,750 t dry CaO/voyage |
| Discharged as | ~84,000 t Ca(OH)₂ equivalent/voyage |
| Design discharge rate | ~100 kg/s Ca(OH)₂ (50 kg/s validated baseline) |
| Trips per year | ~28–30 |
| Annual delivery | ~1.8–1.9 Mt CaO/yr |
| Ships per plant | ~1.3 ships/plant |
At the validated 50 kg/s baseline the same hull still delivers ~1.3 Mt CaO/yr (thanks to the dry-cargo gain), so the program degrades gracefully if the 100 kg/s target is not ecologically achievable.
7.2 Ship Systems
A purpose-built dispersal vessel needs more than a dry-bulk hull. It requires:
- sealed dry CaO cargo containment with moisture control
- onboard slaking reactors sized for continuous discharge
- seawater intake pumps
- heat management for exothermic hydration
- slurry dilution and homogenization
- multipoint wake injection manifold and towed diffuser interfaces
- pH, alkalinity, turbidity, and conductivity sensors
- auto-throttling discharge controls
- satellite data reporting
- environmental black box / MRV recorder
- corrosion-resistant wetted systems
- crew protection from caustic dust and slurry
- low-carbon propulsion (methanol, ammonia, or wind-assist) — at thousands of hulls, fleet fuel emissions directly erode net removal (§10.4)
7.3 Release-Rate Constraint
There is no universal safe release rate. The limiting factors are local pH spikes, wake dilution, carbonate precipitation, turbidity, local ecology, and regulatory thresholds. The constraint is fundamentally one of local dilution, which is an engineering variable — more injection points and more mixing energy raise the safe rate — but every rate must be validated through field trials and route-specific permits. The 100 kg/s design target is a program goal to be earned in Phases 1–2, not an assumed entitlement; 50 kg/s remains the permitted planning floor.
8. Global System Scale
For a 10 GtCO₂/yr gross target, with credited uptake of 1.1–1.4 tCO₂/tCaO, the system requires the following approximate infrastructure.
| System element | Low case | High case |
|---|---|---|
| Limestone mined | 13 Gt/yr | 16 Gt/yr |
| Quicklime produced | 7.1 Gt CaO/yr | 9.1 Gt CaO/yr |
| Captured calcination CO₂ | 5.6 GtCO₂/yr | 7.2 GtCO₂/yr |
| Standard plants | ~2,900 | ~3,600 |
| Nuclear capacity | ~0.9 TWe | ~1.4 TWe (baseline; ~0.5–0.8 TWe-eq with direct-heat calcination) |
| Purpose-built ships | ~3,800 | ~5,000 |
| Major ports/terminals | hundreds | hundreds |
| CO₂ disposal requirement | multi-Gt/yr | multi-Gt/yr (geological + AWL) |
This scale is larger than today’s cement/lime sector and would require a new global supply chain for nuclear modules, calciner trains, refractory materials, bulk logistics, CO₂ compressors, pipelines, injection wells, shipyards, lime-handling ports, and ocean-monitoring systems. The fleet and nuclear figures above already reflect the dry-cargo, high-rate-discharge, and heat-integration decisions; without them the same target would demand ~8,000–10,000 ships and ~1.2–1.9 TWe.
9. Measurement, Reporting, and Verification
Ocean alkalinity enhancement cannot be credited by simply measuring tonnes of lime released. The MRV system must track the entire chain:
- limestone mass and chemistry
- calciner operation
- calcination CO₂ generated
- CO₂ captured, compressed, transported, and stored (or verifiably converted via AWL)
- quicklime mass and reactivity
- transport and port losses
- ship loading and discharge location
- local seawater chemistry
- carbonate precipitation risk
- modeled air-sea CO₂ flux
- air-sea equilibration completeness — alkalinity subducted below the mixed layer before ingassing completes loses credited uptake, so discharge routes and seasons must be selected and modeled for surface residence time
- long-term ocean retention
- ecological monitoring
- fleet and supply-chain lifecycle emissions, netted against gross uptake
NOAA emphasizes that monitoring and modeling are central to understanding ocean chemistry changes and linking those changes to impacts on marine life and people.9
A crediting protocol should require:
- no credit without verified disposal of calcination CO₂
- conservative discounting for ocean uptake uncertainty
- dynamic route-specific limits
- independent audit of ship discharge data
- open environmental data publication
- biological-response thresholds that can automatically pause operations
10. Rollout Plan
Phase 0 — Science, Bench Testing, and Governance
Scale: pre-commercial
Capital: $1–3B
Objectives:
- validate lime quality and dissolution behavior
- quantify precipitation risk
- run mesocosm and small controlled field experiments
- define pH and ecological safety thresholds
- begin dispersal-optimization research: particle size, dilution engineering, route/season selection for maximum credited uptake
- build MRV models including equilibration-time effects
- define permitting framework
- identify Tier-1 candidate sites (coastal quarry + port + storage co-location)
Go/no-go gate:
Proceed only if ocean uptake can be measured and ecological effects remain within acceptable limits under controlled conditions.
Phase 1 — Pilot Calciner and Test Vessel
Scale: 10,000–100,000 tCO₂/yr gross uptake
Capital: $2–6B
Build:
- small direct-separation calciner with full heat integration
- steam-mediated calcination test rig (direct nuclear heat pathway, §3.3.B)
- non-nuclear or demonstration nuclear heat/electric connection
- CO₂ compression/storage link
- AWL pilot contactor at a coastal site (§5)
- one test port module
- one modified or purpose-built test vessel with onboard slaking
- staged discharge-rate trials from 50 kg/s toward 100 kg/s with high-density monitoring
Go/no-go gate:
Demonstrate full-chain accounting: limestone in, CO₂ disposed, alkalinity released, ocean chemistry response measured, and lifecycle emissions verified.
Phase 2 — First Full Integrated Module
Scale: one standard plant + 2 ships
Capital: $14–28B first-of-a-kind
Build, preferentially at a Tier-1 coastal site:
- 4.5 Mt/yr limestone input plant with recuperative heat integration
- 2.5 Mt/yr CaO output
- 2 MtCO₂/yr calcination CO₂ disposal (geological or AWL)
- 4–5 module HTGR cogeneration package
- one full port terminal (co-located if Tier 1)
- 2 purpose-built dispersal ships
Go/no-go gate:
Establish the first copy-exactly reference design and prove multi-year operation without unacceptable environmental or logistical failure.
Phase 3 — Regional Cluster
Scale: 10–50 plants, 13–65 ships
Capital: $90–220B for first 10-plant cluster
Cluster around:
- major limestone basin, coastal where possible
- shared multi-GW nuclear park serving 5–10 plants (§3.3.C), cutting licensing actions ~10×
- shared CO₂ storage hub and/or AWL capacity
- capable port network
- favorable ocean dispersal routes with long surface residence times
Go/no-go gate:
Demonstrate regional supply-chain repeatability, shared CO₂ disposal, nuclear-park licensing replication, port throughput, independent MRV, and validated discharge rates.
Phase 4 — Industrial Scale
Scale: 100–500 plants, 130–650 ships
Capital: $0.8–2.2T for first 100 plants
Objectives:
- factory production of calciner trains
- repeatable nuclear park deployment
- commercial deployment of steam-mediated direct-heat calcination if Phase 1–3 R&D succeeds
- shipyard serial builds
- shared CO₂ pipeline/storage networks
- standardized port terminals
- international governance standards
Go/no-go gate:
Confirm mature cost curve and ecological safety before expanding toward gigaton scale.
Phase 5 — Gigaton and Multi-Gigaton Scale
Scale: ~290–360 plants per GtCO₂/yr gross target
Capital: ~$2.5–6T per GtCO₂/yr capacity
At this scale, the program becomes a global industrial infrastructure buildout rather than a climate-tech project.
11. Cost Estimate
This is a Class 5 / rough-order-of-magnitude estimate. It is intended for strategic screening, not project finance.
11.1 One Standard Module Capital Cost
| System block | Mature repeat build | First-of-a-kind / early build |
|---|---|---|
| Nuclear island, 4–5 HTGR cogeneration modules | $2.5–5B | $5–10B |
| Direct-separation calcination plant w/ heat integration | $1.5–3.5B | $3–6B |
| Limestone receiving, prep, silos, rail (Tier 2) | $0.8–1.8B | $1.2–2.5B |
| — same, Tier-1 conveyor-fed site | $0.3–0.8B | $0.5–1.2B |
| CO₂ drying, compression, storage interface (or AWL) | $0.4–1.5B | $0.8–2.5B |
| Port terminal share | $0.4–1.2B | $0.8–2.0B |
| Purpose-built ships, ~1.3 per plant | $0.15–0.35B | $0.2–0.5B |
| Engineering, owner’s costs, contingency | $1.3–3.5B | $2.5–7B |
| Total (Tier 2 / Tier 1) | ~$7–17B / ~$6.5–15B | ~$14–28B |
The nuclear line assumes cogeneration with heat integration; if steam-mediated direct-heat calcination is proven, the mature nuclear island drops toward $1.5–3B.
11.2 One Standard Module Annual Operating Cost
| Annual cost item | Rough estimate |
|---|---|
| Limestone mining / quarry supply | $25–75M/yr |
| Rail (Tier 2; ~zero at Tier-1 sites) | $0–200M/yr |
| Nuclear O&M and fuel | $50–120M/yr |
| Calciner maintenance, refractory, labor, consumables | $100–300M/yr |
| CO₂ transport and storage (or AWL pumping) | $20–100M/yr |
| Port operations | $30–100M/yr |
| Ship O&M, crew, fuel, maintenance (~1.3 ships) | $30–90M/yr |
| Ocean MRV, monitoring, permitting | $30–100M/yr |
| Total cash OPEX | ~$0.3–1.1B/yr |
11.3 Cost per Tonne — Gross vs. Net
If a mature module costs $7–17B and is financed over 30 years with an approximately 8% real capital recovery factor, annual capital recovery is roughly $0.6–1.5B/yr. Adding OPEX gives a mature annual cost per module of approximately:
$0.9–2.6B/yr per standard module
Credited gross uptake is ~2.8–3.5 MtCO₂/yr per module. Net removal subtracts lifecycle emissions — mining diesel, rail traction, fleet propulsion, embodied emissions — estimated at ~3–7% of gross provided rail is electrified and ships use low-carbon fuels (with conventional bunker fuel the penalty roughly doubles, which is why clean propulsion is specified in §7.2). Net removal is therefore ~2.6–3.4 MtCO₂/yr per module, implying:
~$250–700/tCO₂ net removed (early through mature builds)
A long-term stretch target of ~$150–300/tCO₂ requires the steam-mediated direct-heat calciner, predominantly Tier-1 siting, validated 100 kg/s discharge, credited uptake near 1.4 tCO₂/tCaO, and fleet-scale learning across nuclear, calciner, port, and ship builds. Under the prior architecture (all-electric calcination, hydrated-lime cargo, 50 kg/s discharge, universal rail) the equivalent range was ~$300–800/t; the design decisions in this paper shift the central estimate down roughly a third.
11.4 Full 10 GtCO₂/yr System Capital Cost
| System block | Global estimate |
|---|---|
| Nuclear islands / parks | $8–18T ($5–12T with direct-heat calcination) |
| Calcination plants | $5–15T |
| Rail terminals, storage, materials handling | $2–6T |
| CO₂ compression, pipelines, injection, AWL | $2–7T |
| Port terminals | $2–6T |
| Dedicated ships | $0.4–0.9T |
| Engineering, contingency, supply-chain buildout | $7–20T |
| Total overnight capital | ~$28–70T |
11.5 Full System Annualized Cost
| Cost metric | Estimate |
|---|---|
| Global annualized cost | ~$2.5–6T/yr |
| Central capital estimate | ~$38–50T |
| Likely early/mature net cost | ~$250–700/tCO₂ |
| Stretch long-term cost | ~$150–300/tCO₂ |
Older ocean-liming engineering estimates have suggested lower costs, such as $72–159/tCO₂ in Renforth et al., but those estimates were preliminary and did not include the fully specified nuclear-direct-separation, dedicated-ship, global-MRV architecture described here.10
12. Major Cost Drivers
12.1 Nuclear Capital Cost and Licensing Throughput
The nuclear program remains the largest single cost driver. A difference between $6,000/kW and $12,000/kW changes full-system cost by trillions of dollars, and the IEA notes that nuclear expansion faces policy, construction, and financing risks even amid renewed interest.11 Two structural mitigations are built into this design: cogeneration with heat integration (smaller islands per plant) and nuclear parks serving plant clusters (roughly 10× fewer licensing actions). The steam-mediated direct-heat calciner, if proven, is the single largest remaining lever.
12.2 Direct-Separation Calciner Scale-Up
Direct-separation calcination is promising but not yet demonstrated at the thousands-of-plants scale, and the steam-mediated low-temperature variant is earlier still. Both must scale from pilot facilities to multi-million-tonne-per-year plants through the phase gates.
12.3 CO₂ Disposal
Each standard plant needs to dispose of about 2 MtCO₂/yr. Geological storage remains the baseline; the AWL variant (§5) prevents storage access from being a universal disqualifier, at the cost of coastal-only siting and large water-handling systems.
12.4 Bulk Logistics and Lifecycle Emissions
The project moves more than ten billion tonnes per year of limestone and lime at full scale. Tier-1 siting deletes rail where geography allows; elsewhere, rail yards, covered hoppers, silos, ports, and ship loaders are core assets. Because the fleet and rail system are large enough to erode net removal, electrified rail and low-carbon marine fuels are accounting requirements, not sustainability preferences.
12.5 Fleet Size and Discharge-Rate Validation
Fleet size scales inversely with achievable discharge rate. The difference between 50 and 100 kg/s is roughly $0.3–0.7T of ships plus proportional crewing and O&M. Dispersal engineering and its ecological validation therefore carry infrastructure-scale value.
12.6 Ocean MRV, Credited Uptake, and Environmental Liability
Uncertainty in ocean response can reduce credited tonnes, increase monitoring costs, or halt deployment. Conversely, dispersal optimization that raises credited uptake from 1.1 toward 1.4 tCO₂/tCaO is worth roughly a fifth of total system cost. Ecological governance is a first-order cost driver in both directions.
13. Risk Register
| Risk | Description | Mitigation |
|---|---|---|
| Net-removal failure | Ocean uptake lower than expected | Conservative crediting, field trials, route-specific MRV, equilibration modeling |
| Carbonate precipitation | Added alkalinity forms solids instead of storing CO₂ as bicarbonate | Dilution, particle-size control, monitoring saturation state |
| Local pH spikes | Discharge damages organisms in ship wake | Multipoint release, towed diffusers, auto-throttling, exclusion zones |
| Discharge-rate validation | 100 kg/s target proves ecologically unachievable | Graceful fallback to 50 kg/s (fleet grows ~2×; dry-cargo gain retained) |
| CO₂ storage bottleneck | Storage cannot accept multi-Gt/yr flows | Tier-1 siting near basins; shared pipeline networks; AWL variant at coastal sites |
| Nuclear cost overrun | SMR/HTGR costs remain high | Cogeneration, nuclear parks, standardization, fleet learning, regulated asset models |
| Nuclear licensing throughput | Thousands of site licenses stall deployment | Nuclear parks serving 5–10 plants each; copy-exactly design |
| Calciner scale-up failure | Direct-separation or steam-mediated equipment underperforms | Phase-gated pilots, multiple train vendors, electric baseline retained |
| Feedstock quality | Dolomitic or impure limestone degrades slaking and alkalinity yield | Formal feedstock specification; chemistry as a siting criterion |
| Rail congestion | Material flows overwhelm corridors | Tier-1 rail-free siting; dedicated unit-train infrastructure; clustering |
| Port opposition | Caustic material handling faces local resistance | Enclosed systems, safety standards, community benefits |
| International ocean governance | Permits or treaties restrict release | Early engagement, transparent MRV, multilateral protocols |
| Public acceptance | Nuclear plus ocean intervention faces opposition | Independent oversight, open data, phased deployment |
14. Go / No-Go Criteria
Do not scale beyond each phase unless the following are proven:
| Gate | Required proof |
|---|---|
| Net carbon removal | Full lifecycle removal is positive and independently verified |
| CO₂ disposal | Calcination CO₂ is permanently stored or verifiably converted via AWL |
| Ocean safety | pH, turbidity, precipitation, and biological impacts remain within limits |
| Discharge rate | Design release rates are validated ecologically, not just engineered |
| MRV | Ocean uptake can be quantified conservatively and repeatedly |
| Nuclear integration | Industrial operations do not compromise nuclear safety |
| Logistics | Quarries, ports, ships, and disposal operate at high uptime |
| Cost | Cost curve is competitive with other durable CDR pathways |
| Governance | Local, national, and maritime authorities approve deployment |
15. Recommended Development Strategy
The correct financing path is not to start with a 10 GtCO₂/yr program. The recommended sequence is:
- $1–3B science and governance phase — including dispersal optimization and Tier-1 site identification
- $2–6B pilot system — including steam-calcination rig, AWL pilot, and discharge-rate trials
- $14–28B first integrated full module at a Tier-1 coastal site
- $90–220B ten-plant regional cluster around a shared nuclear park
- $0.8–2.2T hundred-plant industrial program
- Only then evaluate gigaton-scale expansion
The first full module should be treated as the reference design. The goal is not maximum optimization; the goal is a replicable plant-port-ship-MRV package. The three R&D lines with infrastructure-scale payoffs — steam-mediated direct-heat calcination, high-rate dispersal, and credited-uptake optimization — should be funded from Phase 0 onward because their value compounds across every subsequent plant and ship.
16. Conclusion
The best version of the proposed system is:
A heat-integrated, nuclear-cogeneration lime-and-CCS plant sited on coastal limestone wherever geography allows, producing dry quicklime delivered to purpose-built 75,000 dwt ships that slake it with seawater and release it at engineered high rates into controlled open-ocean alkalinity plumes, with every tonne tracked from quarry to ocean, every tonne of calcination CO₂ stored or converted to bicarbonate, and credited uptake actively optimized rather than passively discounted.
At pilot scale, this is a high-risk engineering and marine-science demonstration.
At regional scale, it becomes a new industrial sector.
At 10 GtCO₂/yr, it becomes a planetary infrastructure program requiring tens of trillions of dollars, terawatt-scale firm clean energy, multi-gigaton CO₂ disposal, thousands of plants, thousands of ships, and global ocean governance.
The concept should therefore be pursued only through strict phase gates, conservative crediting, transparent environmental monitoring, and explicit comparison against other durable carbon-removal pathways.
References
Footnotes
-
IPCC Emission Factor Database, “Other Process Uses of Carbonates,” default limestone emission factor: 440 kgCO₂/t limestone. https://www.ipcc-nggip.iges.or.jp/efdb/find_ef.php?ipcc_code=2.A.4&ipcc_level=2 ↩
-
IPCC Emission Factor Database, “Lime Production,” high-calcium quicklime process emission factor: 0.79 tCO₂/t quicklime. https://www.ipcc-nggip.iges.or.jp/efdb/find_ef.php?ipcc_code=2.A.2&ipcc_level=2 ↩
-
NOAA Ocean Acidification Program, Carbon Dioxide Removal / Ocean Alkalinity Enhancement. https://oceanacidification.noaa.gov/focus_areas/carbon-dioxide-removal/ ↩
-
LEILAC, “Leilac’s Technology — Our Carbon Abatement Solution.” https://www.leilac.com/technology/ ↩
-
U.S. Nuclear Regulatory Commission, “X-energy LLC — Xe-100.” https://www.nrc.gov/reactors/new-reactors/advanced/who-were-working-with/pre-application-activities/xe-100 ↩
-
Global CCS Institute, “Cost of CO₂ Storage,” 2025. https://www.globalccsinstitute.com/publications/ ↩
-
Rau, G.H. & Caldeira, K., “Enhanced carbonate dissolution: a means of sequestering waste CO₂ as ocean bicarbonate,” Energy Conversion and Management, 1999. https://www.sciencedirect.com/science/article/abs/pii/S0196890499000712 ↩
-
Caserini, S. et al., “Potential of Maritime Transport for Ocean Liming and Atmospheric CO₂ Removal,” Frontiers in Climate, 2021. https://www.frontiersin.org/journals/climate/articles/10.3389/fclim.2021.575900/full ↩ ↩2
-
NOAA Ocean Acidification Program, “Monitoring & Modeling.” https://oceanacidification.noaa.gov/ocean-acidification-research/ocean-acidification-monitoring/ ↩
-
Renforth, P. et al., “Engineering challenges of ocean liming,” Energy, 2013. https://www.sciencedirect.com/science/article/abs/pii/S0360544213006816 ↩
-
International Energy Agency, “The Path to a New Era for Nuclear Energy,” 2025. https://www.iea.org/reports/the-path-to-a-new-era-for-nuclear-energy ↩
This article represents my personal opinions and research. Nothing in this article should be taken as professional, financial, legal, or investment advice.