A Tethered-Balloon Stratospheric Aerosol Injection System Sized for 1.5 °C of Cooling
1. Executive summary
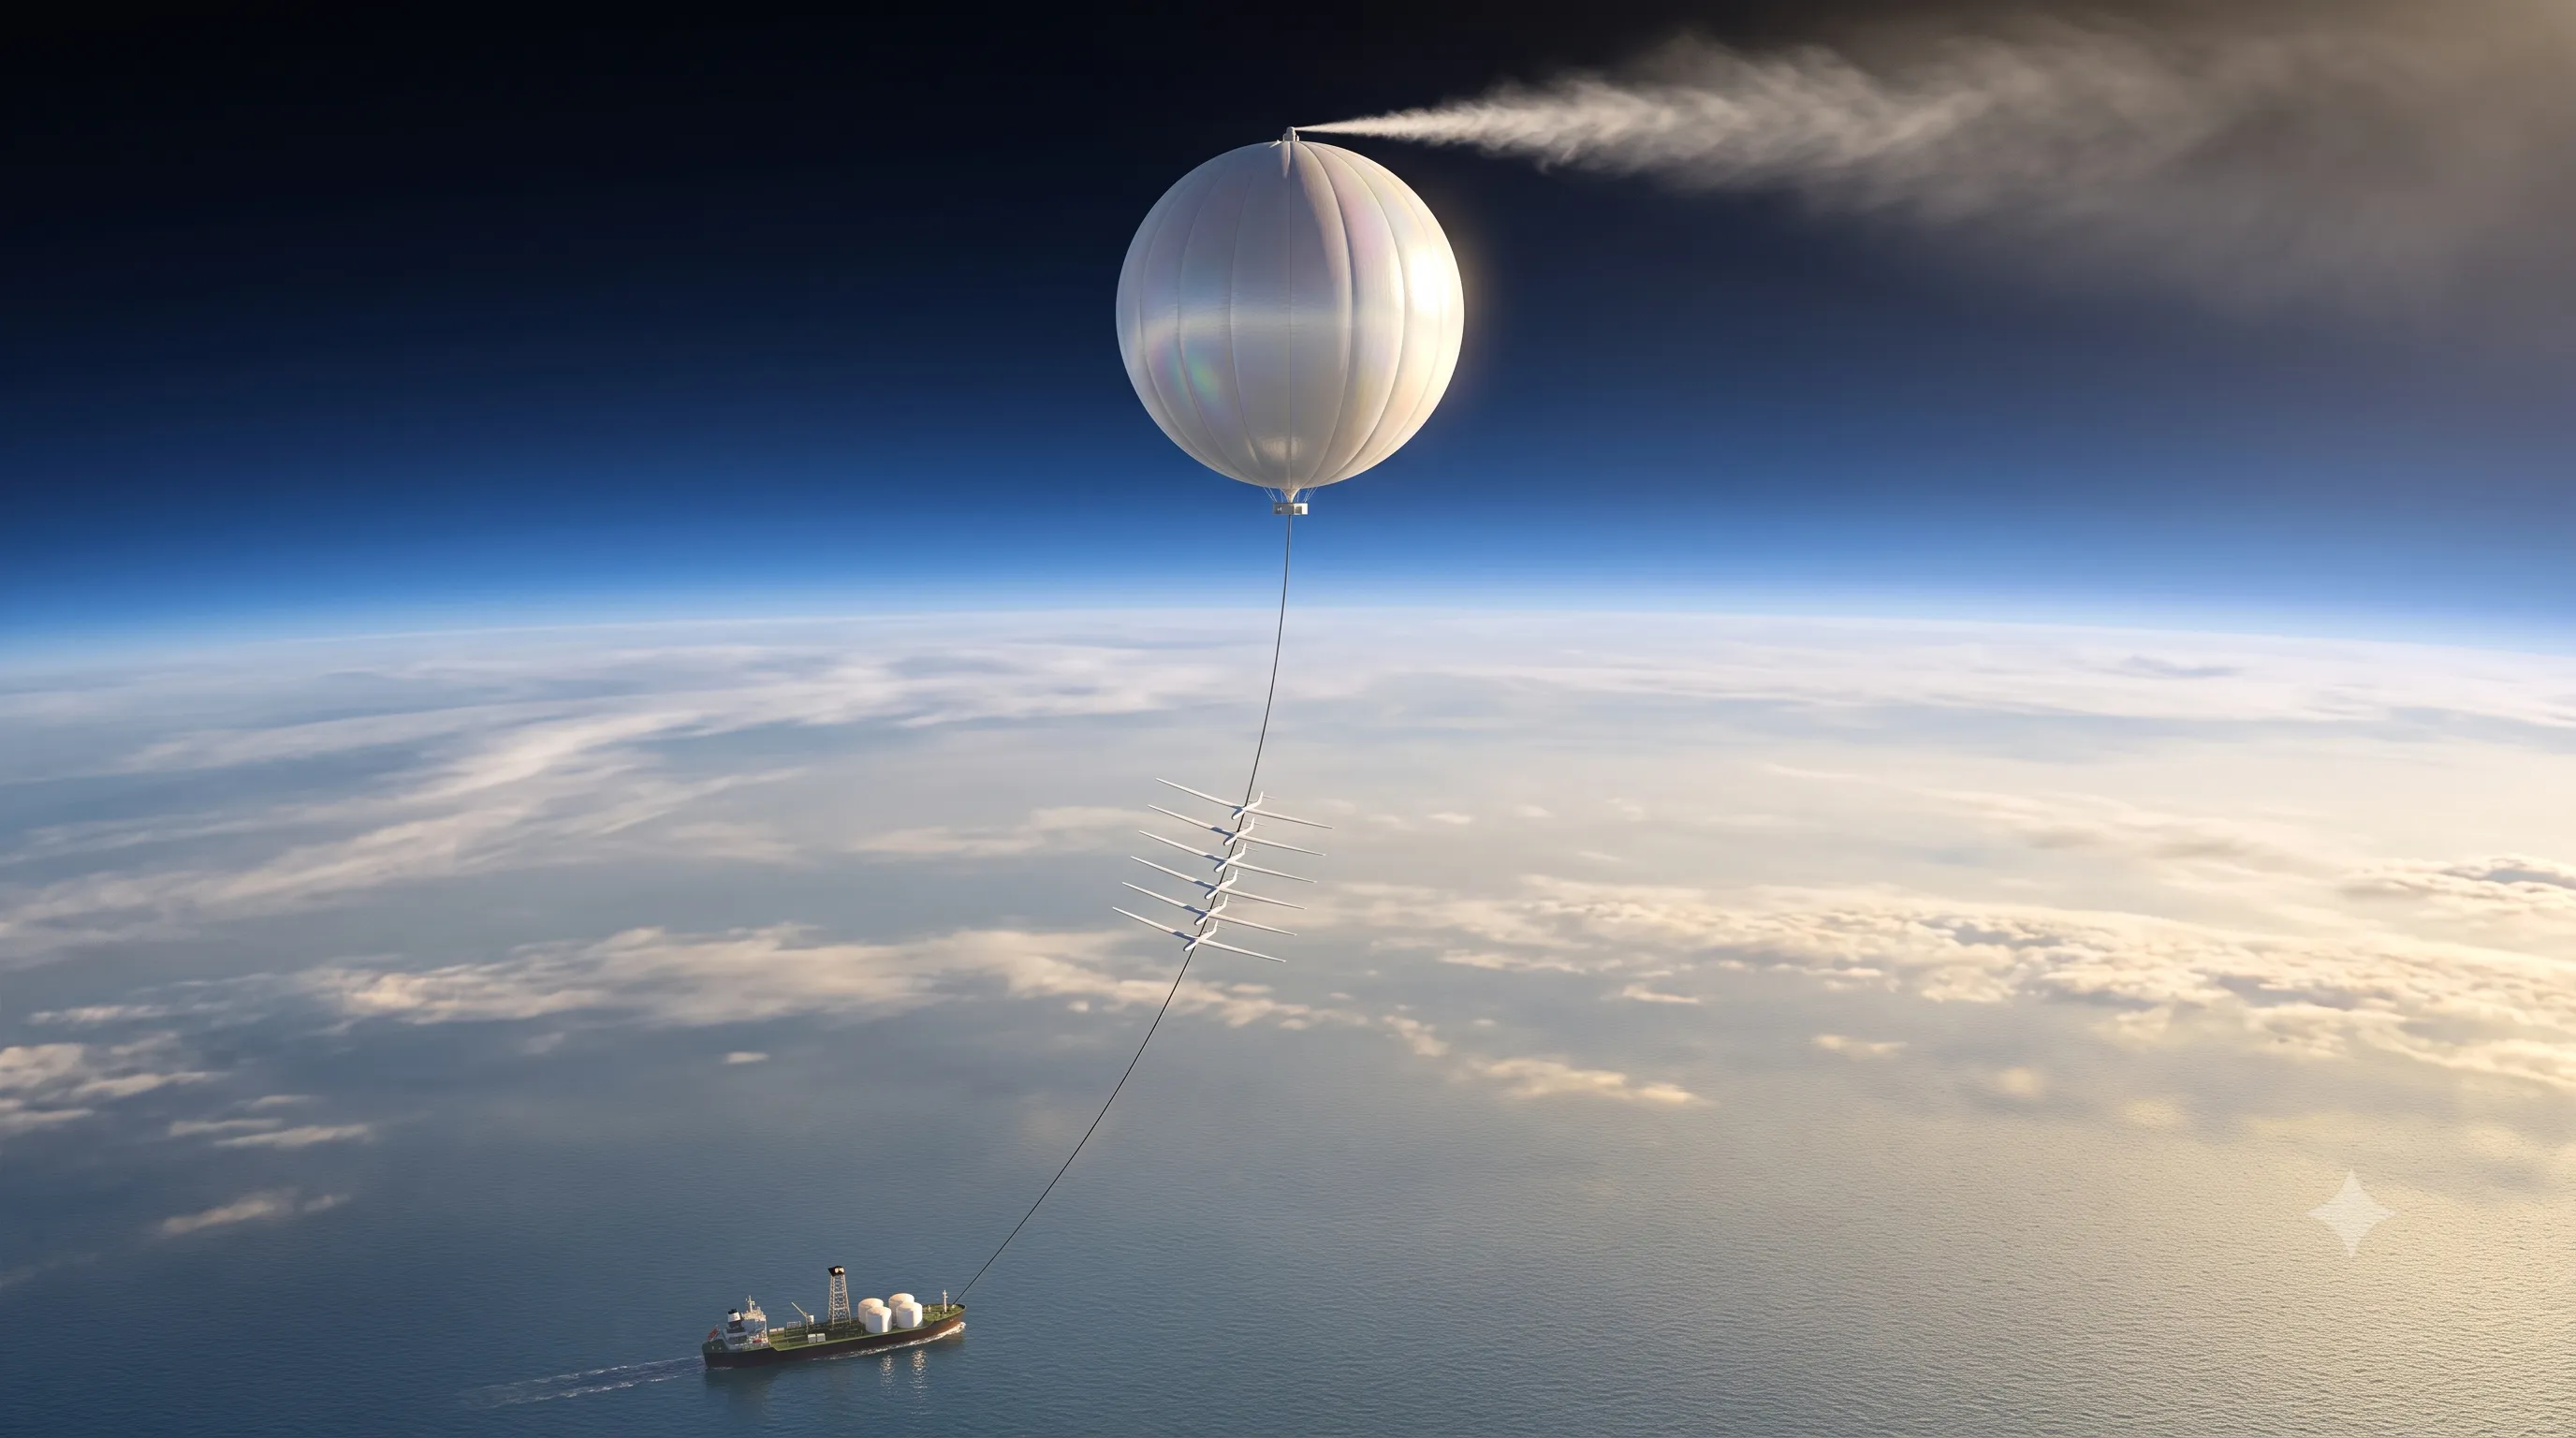
This whitepaper develops the tethered-balloon delivery concept of Davidson, Burgoyne, Hunt & Causier (2012) into a full system design sized to produce a sustained global mean cooling of 1.5 °C.1 The core architecture is unchanged from the source paper: a ground station pumps liquefied SO₂ at up to 6,000 bar through a fiber-reinforced pipe that doubles as a tether, held at 20 km altitude by a large hydrogen-filled pressurized balloon, with glider-like lifting surfaces on the tether to carry jet-stream drag.
Headline numbers:
- Injection rate: 10 Mt SO₂/yr nominal, with built-in surge capacity to 15 Mt/yr, delivered above 20 km within ±20° of the equator.
- System scale: six balloon/tether stations across four equatorial sites (two ship-based, two island/desert-based); four stations pumping at any time meets the nominal rate, six meets surge.
- Per-station throughput: 96 kg/s of supercritical SO₂ (≈2.5 Mt/yr at 300 operating days).
- Per-station hardware: one 315 m diameter pressurized hydrogen balloon, one 21.5 km aramid-composite tether/pipe (200 mm OD / 100 mm bore), ~4,200 m² of tether-mounted lifting surfaces, and a 70 MW ground pump hall.
- Capital cost: ≈$290M per station flyaway; ≈$6B total program capital including sites, SO₂ plants, and development.
- Operating cost: ≈$3.5B/yr at the nominal rate, of which ~$2B is SO₂ feedstock. That is roughly $2.3B per °C-year of cooling — one to two orders of magnitude below aircraft-based SAI estimates at equivalent forcing.
The delivery system is cheap because nothing heavy is thrown away or flown: the lift is free buoyancy, the payload rises through a pipe under ground-based pumping, and the only annually consumed components are the tether and the balloon envelope. The binding engineering risks are the balloon (2.6× larger in diameter than anything ever flown), tether creep-rupture, and system dynamics under turbulence — all judged by the source authors to be at the edge of existing practice rather than beyond it.
2. Sizing chain: from 1.5 °C to tonnes per year
The design target is a sustained 1.5 °C reduction in global mean surface temperature relative to the no-intervention trajectory.
Step 1 — Required radiative forcing. For multi-decadal sustained forcing, the realized temperature response is governed by a transient sensitivity of roughly 0.5–0.8 °C per W m⁻². Taking a design value of 0.6 °C per W m⁻²:
F = −1.5 °C ÷ 0.6 °C/(W m⁻²) ≈ −2.5 W m⁻²
(For reference, this is about two-thirds of the forcing from doubled CO₂, and comparable to Pinatubo’s peak forcing sustained indefinitely.)
Step 2 — Forcing per unit injection. Sulfate forcing efficiency degrades with injection rate: at multi-megatonne rates, coagulation grows particles past the optimal ~0.3 µm scattering size, so each additional tonne does less. Continuous-injection modeling (Niemeier & Timmreck 2015; the GLENS ensemble, Kravitz et al. 2017) brackets the efficiency at roughly −0.2 to −0.35 W m⁻² per Tg SO₂/yr at the 10 Tg/yr scale for equatorial injection at 20+ km.23 Design value: −0.25 W m⁻² per Tg SO₂/yr.
Injection rate = 2.5 ÷ 0.25 = 10 Tg (Mt) SO₂ per year
Step 3 — Margin. The efficiency uncertainty band implies a required rate anywhere from ~7 to ~17 Mt/yr. Rather than sizing every station for the worst case, the system is sized at 10 Mt/yr nominal with 50% surge capacity (15 Mt/yr) obtained by running all six stations simultaneously, and the injection rate is set annually by a feedback controller tracking observed temperature and stratospheric aerosol optical depth — the thermostat approach, not a fixed schedule.
This sizing is consistent with the source paper’s own anchor (10 Mt/yr “to mitigate the temperature effects of a doubling of CO₂,” i.e. ~1.8–2 °C of transient warming) and with GLENS-era modeling, where mid-century cooling of ~1.5 °C requires on the order of 10–15 Tg SO₂/yr.
Payload choice. Baseline is SO₂ pumped as a supercritical fluid (density ~1,400 kg/m³ in the pipe), hydrolyzing to sulfuric acid mist in the stratosphere with a ~35-day e-folding time — the well-characterized Pinatubo analog.4 Two upgrade paths are retained but not baselined:
- H₂S precursor: the reaction H₂S + 2O₂ → H₂SO₄ multiplies lofted mass by ~2.9× (vs 1.5× for SO₂), cutting pumped mass to ~3.5 Mt/yr — but H₂S is far more toxic to handle at the ground station.
- Coated TiO₂ slurry: ~1.5–2 Mt/yr of 0.15–0.25 µm coated titania would deliver equivalent scattering with potentially much lower ozone impact and no stratospheric heating; particle cost (~$3–5B/yr, 15–25% of world TiO₂ production) dominates. The same stations can pump either payload — this is the key optionality advantage of a continuous-delivery system.
3. System architecture
| Element | Quantity | Function |
|---|---|---|
| Balloon/tether stations | 6 (4 pumping nominal, 6 surge) | Lift and inject SO₂ at 20 km |
| Sites | 4, within ±20° latitude | Longitudinal dispersal; ≥2 ship-based for relocatability |
| SO₂ plants | 4 (one per site) | Burn delivered sulfur to SO₂, liquefy, store 30 days’ buffer |
| Ground pump halls | 6 | 6,000 bar positive-displacement pumping, 70 MW each |
| Monitoring network | Satellites + 5 stratospheric sampling stations | Aerosol burden, optical depth, ozone; closes the control loop |
Siting. Equatorial, dry-troposphere locations minimize lightning, icing, and storm exposure: candidate classes are (a) dedicated ships or moored platforms in the eastern equatorial Pacific and central Indian Ocean, (b) low-population desert or island sites (e.g., northern Australia, Ascension-class islands) with rail or port access for the ~7,000 t/day site-level sulfur logistics at full rate. Injection need not be continuous — 200–300 pumping days per year suffices given the 1–2 year stratospheric residence time, which is what allows a 4-of-6 operating pattern with weather standdowns and annual tether/balloon change-outs.
Why six stations for a four-station duty. Each station’s tether and balloon are replaced annually (creep-rupture life of the aramid and UV life of the envelope are the drivers), a multi-week evolution involving controlled descent, ballonet inflation, and relaunch. Two spare stations turn maintenance from downtime into rotation and provide the 15 Mt/yr surge margin.
4. Station design
4.1 The balloon
A single station’s lift budget at 20 km (air density 0.088 kg/m³) closes as follows:
| Item | Mass |
|---|---|
| Displacement lift (16.4 × 10⁶ m³ sphere, 315 m dia.) | +1,440 t |
| Hydrogen fill (~0.006 kg/m³ at altitude) | −100 t |
| Envelope + ballonet (375 µm laminate, ~600,000 m² total) | −160 t |
| Tether (dry) | −810 t |
| Pipe contents (supercritical SO₂, 100 mm bore × 21.5 km) | −240 t |
| Gondola, valves, dispersion hardware | −10 t |
| Net margin (blow-over tension reserve) | ≈120 t |
The balloon is a pressurized sphere (superpressure ~800 Pa) rather than a natural-shape zero-pressure balloon, so the envelope stays taut through the high-shear ascent — a tethered balloon cannot ride with the wind the way a free balloon does, and a slack envelope at 10 km in a 95 m/s jet stream would flag and tear. Design wind at altitude is 55 m/s (45 m/s sustained + 20%), which sets the blow-over case and hence the lift margin.
Envelope materials. Multi-layer laminate, 375 µm total: a Vectran or PBO woven scrim for strength (design stress 1,500 N/mm width), biaxially-oriented PET (Mylar-class) film as the hydrogen permeation barrier, polyethylene bonding plies, and an outer PVDF/Tedlar layer for UV endurance (6-month rating at 20 km). Wall stress at operating pressure is a comfortable ~170 N/m². The ballonet — an internal air bag inflated by fans during descent to manage the 14:1 gas volume change — uses the same laminate family and roughly doubles the fabric bill. Fabric at ~$110/m² manufactured (2026) gives ≈$70M per balloon including ballonet, gores welding, and fittings.
At 315 m diameter this is 2.6× the largest balloon ever flown (~120 m). This is the program’s single largest development risk. The fallback, analyzed in the source paper, is an aerodynamically-faired tether with 125 m balloons — roughly 80 balloons for the same total throughput, with comparable total fabric and tether mass. It trades one hard manufacturing problem for fleet complexity, and it is the natural configuration for sub-scale testing either way.
4.2 The tether/pipe
The tether is simultaneously the structural element and the delivery pipe — the design’s central trick and its hardest component.
| Parameter | Value |
|---|---|
| Length | 21.5 km (allows 10–35° lean under 95 m/s jet stream) |
| Outer / inner diameter | 200 mm / 100 mm |
| Structural fiber | Aramid (Twaron/Kevlar-class), 60% fill factor |
| Design stress | 750 MPa (vs 2,700 MPa short-term — the derating covers creep-rupture, pressure biaxiality, temperature, anchorage, and safety factor) |
| Axial capacity | ~10.6 MN (≈1,080 t force) |
| Internal design pressure | 6,000 bar at the base (≈3,000 bar hydrostatic + ≈2,000 bar friction + margin) |
| Dry mass | ~810 t (composite density 1,600 kg/m³) |
| Flow | 96 kg/s SO₂ at ≤9 m/s bore velocity |
Materials. Helically-wound aramid fiber carries hoop stress from the internal pressure; longitudinal aramid carries tension. The bore is lined with a PEEK or fluoropolymer pressure liner (dry SO₂ is non-corrosive, but the liner guarantees fiber isolation from the payload and seals micro-porosity at 6,000 bar). The outer jacket is a hydrophobic, UV-stabilized fluoropolymer — hydrophobicity doubles as icing mitigation over the ~2 km icing-prone altitude band. Aramid is deliberately non-conductive (carbon fiber was rejected on lightning grounds); a sacrificial lightning diverter strategy is carried at the tether base. PBO (Zylon) at ~1,500 MPa design stress is the block-II upgrade: it would halve the required balloon volume, pending creep-rupture characterization.
Fabricated cost at ~$45/kg: ≈$35M per tether, replaced annually. Manufacture is a retooling of existing offshore-umbilical plant (multi-km continuous runs of 5–20 cm reinforced pipe are routine in that industry); a dedicated line is ~$60M of the development budget.
4.3 Lifting surfaces
The jet-stream band (7–13 km) drags the bare tether sideways; without help, the balloon must supply all restoring tension and grows impractically. Glider-like composite wings clamped to the tether through that band — ~4,200 m² total wing area per station, autonomous pitch control, glass/carbon construction — generate lift that locally carries the drag. Cost ≈$17M per station based on scaled sailplane pricing.
4.4 Ground station and pumps
- Pumps: ~25 positive-displacement intensifier units of 160 L/min each (plus 5 spares), staged to 6,000 bar — a 10–100× flow scale-up of commercial 7 L/min waterjet intensifiers, which the source analysis found routine. SO₂-wetted parts in duplex stainless / Hastelloy C-276. Installed cost ≈$95M per station including high-pressure manifolds and the tether anchorage/swivel.
- Power: 60 MW hydraulic → ≈70 MW electrical at 85% motor efficiency. Ship stations carry LNG gensets; land stations use grid or dedicated gas turbines with solar offset. 490 GWh/yr per operating station.
- Launch/recovery plant: winch train, ballonet fans, hydrogen farm (~100 t fill plus permeation top-up — a trivial cost line), and weather radar. ≈$40M.
- Dispersion head: at the top, the supercritical SO₂ flashes through micronizing nozzles into a buoyant plume; electrostatic charging at the nozzle exit suppresses near-field coagulation. Carried in the gondola mass budget; development item rather than a major cost line.
5. Cost summary (2026 USD)
Source-paper 2011 GBP figures are escalated ×1.5 for inflation and converted at $1.27/£, then cross-checked against the paper’s own US-data cross-checks.
Capital
| Item | Per station | Program (6 stations, 4 sites) |
|---|---|---|
| Balloon + ballonet | $70M | $420M |
| Tether/pipe (first unit) | $35M | $210M |
| Lifting surfaces | $17M | $100M |
| Pump hall + anchorage | $95M | $570M |
| Launch/recovery plant | $40M | $240M |
| Site infrastructure (2 ships, 2 shore bases, power) | — | $1,300M |
| SO₂ plants + 30-day storage (4 × ~0.9 Mt/yr sulfur-burning) | — | $1,200M |
| Development (tether line, balloon plant, 7 prototype tethers + balloons, dynamics & dispersion program, 400 staff × 4 yr) | — | $1,800M |
| Total program capital | ≈$290M flyaway | ≈$6B |
Operating (nominal 10 Mt/yr, 4 stations pumping, 6 in rotation)
| Item | $/yr |
|---|---|
| Annual tether replacement (6×) | $210M |
| Annual balloon replacement (6×) | $420M |
| Electricity (~2,000 GWh at $0.12/kWh) | $250M |
| Pump maintenance (15% of pump capital) | $85M |
| Ships, sites, operations staff | $300M |
| Sulfur feedstock + SO₂ production (5 Mt S/yr ≈ 6% of world supply, delivered) | $2,000M |
| Monitoring, modeling, control center | $200M |
| Total | ≈$3.5B/yr |
Cost-effectiveness: ~$2.3B per °C-year. Ten-year net present cost at 5% is ≈$33B. For comparison, purpose-built high-altitude aircraft programs are estimated at $18–20B/yr in 2026 dollars at comparable forcing (scaling Smith & Wagner-class estimates to 10 Mt/yr at 20+ km), and every batch-delivery option costed in the source paper (artillery, missiles, coilguns, free balloons) is 10–300× more expensive.5 Note that at these rates the feedstock, not the delivery system, dominates operating cost — the delivery system proper runs ≈$1.5B/yr.
6. Deployment path and control
The system should not be built in one step. Following the source paper’s roadmap, compressed for a program that has already cleared laboratory phases:
| Phase | Scale | Hardware | Duration |
|---|---|---|---|
| Pre-trial | 100 t/yr N₂ | 150,000 m³ aerostat, 40 mm sub-scale tether | 2–3 yr |
| Micro trial | 100 t/yr SO₂ (0.001%) | Same rig, live payload, plume chemistry validation | 2–3 yr |
| Mini test | 10 kt/yr (0.1%) | One 125 m balloon station | 3–4 yr |
| Pilot | 500 kt/yr (5%) | First full 315 m station | 3 yr |
| Full build | 10 Mt/yr | Six stations, four sites | 4 yr build + ramp |
Ramp rate at full scale is capped by the feedback controller (annual adjustment against observed temperature and aerosol optical depth), not by a schedule. Termination-shock exposure is bounded by the 1–2 year aerosol lifetime; the 30-day site storage and 4-of-6 station redundancy mean no single industrial, meteorological, or political failure at one site forces an abrupt stop.
Open engineering risks, in order: (1) manufacture and first launch of the 315 m balloon — mitigated by the 80 × 125 m faired-tether fallback; (2) aramid creep-rupture statistics at 750 MPa over 1-year deployments — mitigated by annual replacement and the PBO upgrade path; (3) coupled tether–balloon dynamics in severe turbulence — existing 20 km simulations show benign response, but full-scale validation is exactly what the mini-test phase is for; (4) dispersion-head performance (particle size control at the nozzle) — the factor that ultimately sets forcing efficiency and therefore total system scale.
What this design does not solve: ozone chemistry of sulfate at 10 Mt/yr scale (the TiO₂ option exists for this reason), regional precipitation shifts, ocean acidification (untouched by any SRM), and governance. Those are properties of stratospheric aerosol injection itself, not of the lifting method — but the tethered balloon’s continuous, throttleable, payload-agnostic delivery is the configuration best suited to responding to whatever the monitoring network finds.
References
Footnotes
-
Davidson, P., Burgoyne, C., Hunt, H. & Causier, M., “Lifting options for stratospheric aerosol geoengineering: advantages of tethered balloon systems,” Philosophical Transactions of the Royal Society A, 2012. https://doi.org/10.1098/rsta.2011.0639 ↩
-
Niemeier, U. & Timmreck, C., “What is the limit of climate engineering by stratospheric injection of SO₂?” Atmospheric Chemistry and Physics, 2015. https://doi.org/10.5194/acp-15-9129-2015 ↩
-
Kravitz, B. et al., “First simulations of designing stratospheric sulfate aerosol geoengineering to meet multiple simultaneous climate objectives,” Journal of Geophysical Research: Atmospheres, 2017. https://doi.org/10.1002/2017JD026874 ↩
-
Pierce, J.R. et al., “Efficient formation of stratospheric aerosol for climate engineering by emission of condensible vapor from aircraft,” Geophysical Research Letters, 2010. https://doi.org/10.1029/2010GL043975 ↩
-
Smith, W. & Wagner, G., “Stratospheric aerosol injection tactics and costs in the first 15 years of deployment,” Environmental Research Letters, 2018. https://doi.org/10.1088/1748-9326/aae98d ↩
This article represents my personal opinions and research. Nothing in this article should be taken as professional, financial, legal, or investment advice.